The canonical pipeline order
HyperTools composes several independent operations – imputing missing values, per-dataset manipulation, normalization, dimensionality reduction, hyperalignment, clustering, and finally plotting/animating – into a single pipeline. Every dispatcher that accepts more than one of these as kwargs (hypertools.plot, hypertools.analyze, hypertools.reduce, hypertools.align, hypertools.cluster, hypertools.manip, hypertools.normalize) runs them in the same order, so that composing stages via kwargs always means the same thing no matter which function you called it from (GH #153, GH #138).
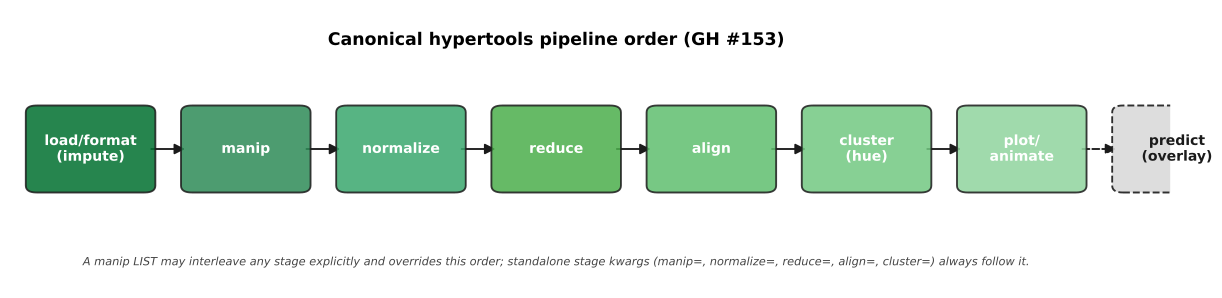
The canonical order
load/format (impute happens here)
  -> manip
  -> normalize
  -> reduce
  -> align
  -> cluster (hue)
  -> plot/animate
  -> predict overlays
Why this order
Impute must precede everything. Every downstream model (manip, normalize, reduce, align, cluster) assumes complete data; missing values are filled in during hypertools.load/format_data, before any other stage sees the data.
Manip runs in native (per-dataset) space. hypertools.manip operations – smoothing, resampling, z-scoring – are per-dataset preprocessing steps (e.g. denoising a single subject’s timeseries) that are most meaningful in the data’s original feature space, before anything has been rescaled or projected. Note that while
SmoothandResampleare applied fully independently to each dataset in a list,ZScoreandNormalizetransform each dataset separately but fit ONE shared set of statistics (mean/std, or baseline/peak) across every dataset in the list – likehypertools.normalize’s'across'mode (see the hypertools.manip docstring).Normalize standardizes feature scales before any distance- or variance-based model (reduce, align, cluster) is fit, so that no single feature’s arbitrary scale dominates the geometry those models discover.
Reduce projects to the target dimensionality before align. This preserves hypertools 0.x semantics – hypertools.analyze has always been equivalent to
align(reduce(normalize(x)))– and keeps hyperalignment tractable: Procrustes/HyperAlign work with a handful of dimensions far more efficiently (and far more robustly against overfitting) than with the raw, high-dimensional feature space.Align rotates the reduced datasets into a shared space, so that corresponding dimensions across datasets/subjects/timepoints are comparable, which every downstream step (cluster, plot, predict) then relies on.
Cluster labels the final (reduced, aligned) space, most commonly to drive plot coloring (
hue), so it runs last among the “geometry” stages – after the space it is labeling has been fully constructed.Plot/animate renders the finished pipeline, and predict overlays a forecast/extrapolation on top of the rendered result – it is drawn last because it depends on (and visually augments) the already-plotted trajectory rather than feeding back into any earlier stage.
Overriding the order
Standalone stage kwargs (manip=, normalize=, reduce=,
align=, cluster=) always run in the canonical order above, with the
calling function’s own stage (if any) slotted in at its position. A
manip= list may instead interleave any of the stages explicitly –
an explicit list always overrides the canonical order for the stages it
names. For example:
import hypertools as hyp

# canonical order: normalize -> reduce -> align -> cluster
hyp.plot(data, reduce='UMAP', align='HyperAlign', cluster='KMeans',
         normalize='ZScore')

# explicit list overrides the order: smooth first, THEN align, THEN
# reduce with UMAP -- the opposite of "reduce before align"
hyp.plot(data, manip=['Smooth',
                      {'model': 'HyperAlign', 'kwargs': {'n_iter': 10}},
                      'UMAP'])
Every dispatcher also accepts return_model=True to get back the fitted
model for reuse: a single fitted wrapper if only one stage ran, or a fitted
hypertools.Pipeline if the kwargs triggered multiple stages. A fitted
hypertools.Pipeline can be replayed on new data via pipeline= on
hypertools.plot/hypertools.analyze (mutually exclusive with the stage
kwargs above – combining both raises ValueError). See the
pipelines & return_model example for a worked
demonstration.
See also
API reference – full API reference for every stage dispatcher.
How to use HyperTools – worked tutorials covering each pipeline stage.
Story trajectories: brain activity while listening to a story – gallery example that exercises the full manip -> align -> reduce pipeline.