Note
Go to the end to download the full example code.
The Datasaurus Dozen
 run this example as a notebook — or grab the .ipynb (also linked at the bottom of the page)
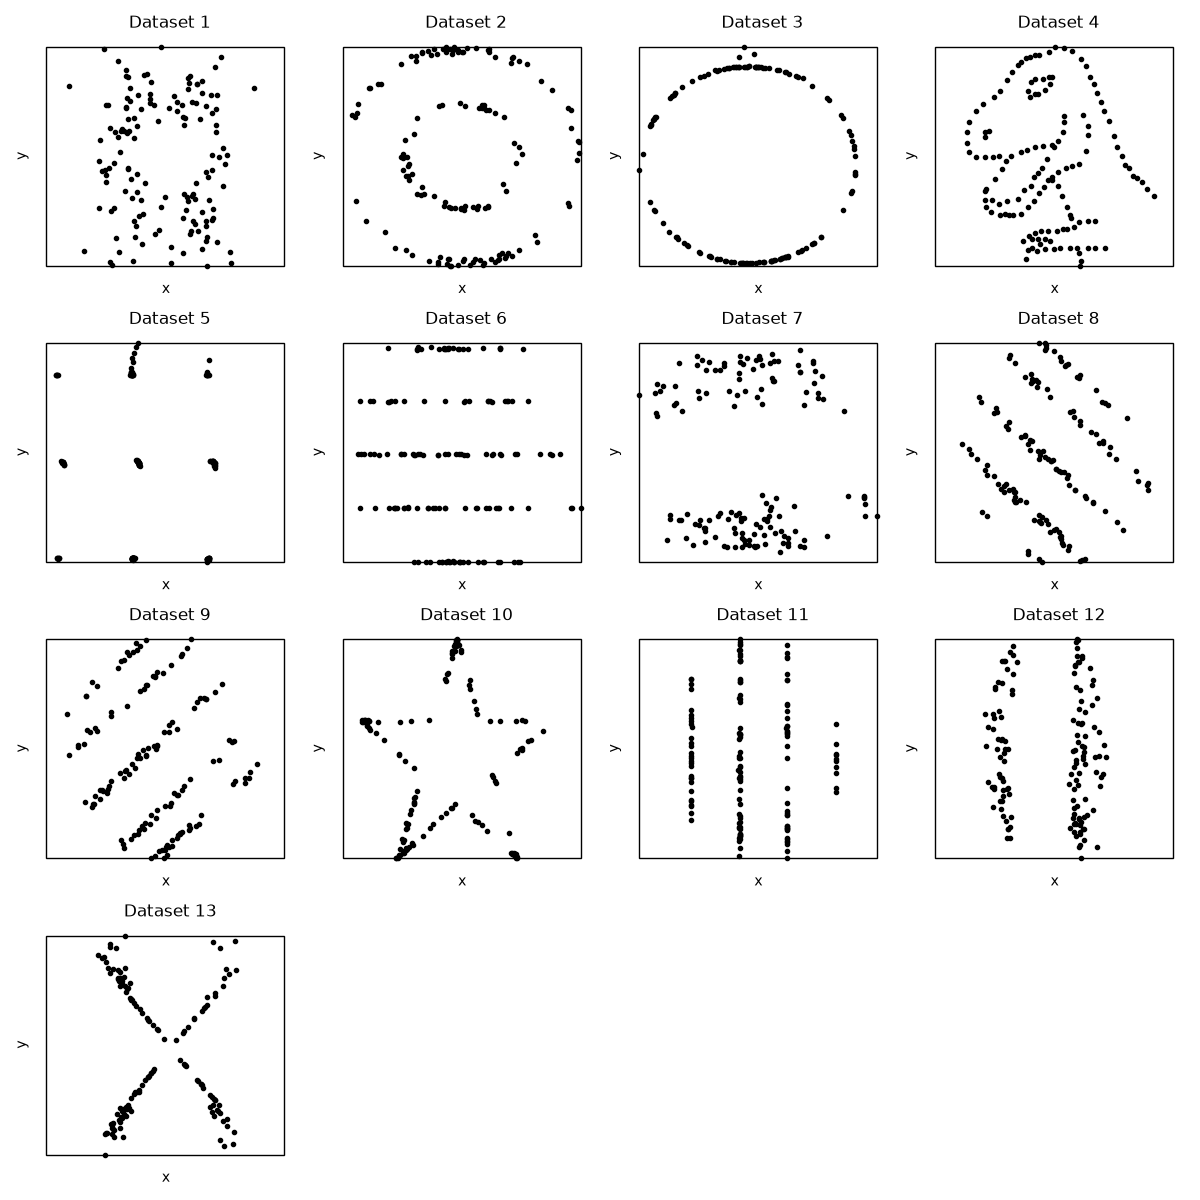
The “Datasaurus Dozen” (Matejka & Fitzmaurice, 2017) is a set of 13
datasets that share nearly identical summary statistics (means,
standard deviations, and correlations) but look wildly different when
plotted. hyp.load(‘datasaurus’) returns the datasets as a list of
pandas DataFrames; here we plot all thirteen side by side as 2D
scatter plots of small black dots (the . point marker) to show why
it always pays to visualize your data.
/home/docs/checkouts/readthedocs.org/user_builds/hypertools/checkouts/latest/hypertools/plot/backend.py:1353: UserWarning: Failed to switch to any interactive backend (TkAgg, QtAgg, Qt5Agg, Qt4Agg, GTK4Agg, GTK3Agg, WXAgg). Falling back to 'Agg'.
  warnings.warn(BACKEND_WARNING)
Dataset 1: mean=(54.27, 47.83), sd=(16.77, 26.94), r=-0.06
/home/docs/checkouts/readthedocs.org/user_builds/hypertools/checkouts/latest/hypertools/plot/backend.py:1353: UserWarning: Failed to switch to any interactive backend (TkAgg, QtAgg, Qt5Agg, Qt4Agg, GTK4Agg, GTK3Agg, WXAgg). Falling back to 'Agg'.
  warnings.warn(BACKEND_WARNING)
Dataset 2: mean=(54.27, 47.83), sd=(16.77, 26.94), r=-0.07
/home/docs/checkouts/readthedocs.org/user_builds/hypertools/checkouts/latest/hypertools/plot/backend.py:1353: UserWarning: Failed to switch to any interactive backend (TkAgg, QtAgg, Qt5Agg, Qt4Agg, GTK4Agg, GTK3Agg, WXAgg). Falling back to 'Agg'.
  warnings.warn(BACKEND_WARNING)
Dataset 3: mean=(54.27, 47.84), sd=(16.76, 26.93), r=-0.07
/home/docs/checkouts/readthedocs.org/user_builds/hypertools/checkouts/latest/hypertools/plot/backend.py:1353: UserWarning: Failed to switch to any interactive backend (TkAgg, QtAgg, Qt5Agg, Qt4Agg, GTK4Agg, GTK3Agg, WXAgg). Falling back to 'Agg'.
  warnings.warn(BACKEND_WARNING)
Dataset 4: mean=(54.26, 47.83), sd=(16.77, 26.94), r=-0.06
/home/docs/checkouts/readthedocs.org/user_builds/hypertools/checkouts/latest/hypertools/plot/backend.py:1353: UserWarning: Failed to switch to any interactive backend (TkAgg, QtAgg, Qt5Agg, Qt4Agg, GTK4Agg, GTK3Agg, WXAgg). Falling back to 'Agg'.
  warnings.warn(BACKEND_WARNING)
Dataset 5: mean=(54.26, 47.84), sd=(16.77, 26.93), r=-0.06
/home/docs/checkouts/readthedocs.org/user_builds/hypertools/checkouts/latest/hypertools/plot/backend.py:1353: UserWarning: Failed to switch to any interactive backend (TkAgg, QtAgg, Qt5Agg, Qt4Agg, GTK4Agg, GTK3Agg, WXAgg). Falling back to 'Agg'.
  warnings.warn(BACKEND_WARNING)
Dataset 6: mean=(54.26, 47.83), sd=(16.77, 26.94), r=-0.06
/home/docs/checkouts/readthedocs.org/user_builds/hypertools/checkouts/latest/hypertools/plot/backend.py:1353: UserWarning: Failed to switch to any interactive backend (TkAgg, QtAgg, Qt5Agg, Qt4Agg, GTK4Agg, GTK3Agg, WXAgg). Falling back to 'Agg'.
  warnings.warn(BACKEND_WARNING)
Dataset 7: mean=(54.27, 47.84), sd=(16.77, 26.94), r=-0.07
/home/docs/checkouts/readthedocs.org/user_builds/hypertools/checkouts/latest/hypertools/plot/backend.py:1353: UserWarning: Failed to switch to any interactive backend (TkAgg, QtAgg, Qt5Agg, Qt4Agg, GTK4Agg, GTK3Agg, WXAgg). Falling back to 'Agg'.
  warnings.warn(BACKEND_WARNING)
Dataset 8: mean=(54.27, 47.84), sd=(16.77, 26.94), r=-0.07
/home/docs/checkouts/readthedocs.org/user_builds/hypertools/checkouts/latest/hypertools/plot/backend.py:1353: UserWarning: Failed to switch to any interactive backend (TkAgg, QtAgg, Qt5Agg, Qt4Agg, GTK4Agg, GTK3Agg, WXAgg). Falling back to 'Agg'.
  warnings.warn(BACKEND_WARNING)
Dataset 9: mean=(54.27, 47.83), sd=(16.77, 26.94), r=-0.07
/home/docs/checkouts/readthedocs.org/user_builds/hypertools/checkouts/latest/hypertools/plot/backend.py:1353: UserWarning: Failed to switch to any interactive backend (TkAgg, QtAgg, Qt5Agg, Qt4Agg, GTK4Agg, GTK3Agg, WXAgg). Falling back to 'Agg'.
  warnings.warn(BACKEND_WARNING)
Dataset 10: mean=(54.27, 47.84), sd=(16.77, 26.93), r=-0.06
/home/docs/checkouts/readthedocs.org/user_builds/hypertools/checkouts/latest/hypertools/plot/backend.py:1353: UserWarning: Failed to switch to any interactive backend (TkAgg, QtAgg, Qt5Agg, Qt4Agg, GTK4Agg, GTK3Agg, WXAgg). Falling back to 'Agg'.
  warnings.warn(BACKEND_WARNING)
Dataset 11: mean=(54.27, 47.84), sd=(16.77, 26.94), r=-0.07
/home/docs/checkouts/readthedocs.org/user_builds/hypertools/checkouts/latest/hypertools/plot/backend.py:1353: UserWarning: Failed to switch to any interactive backend (TkAgg, QtAgg, Qt5Agg, Qt4Agg, GTK4Agg, GTK3Agg, WXAgg). Falling back to 'Agg'.
  warnings.warn(BACKEND_WARNING)
Dataset 12: mean=(54.27, 47.83), sd=(16.77, 26.94), r=-0.07
/home/docs/checkouts/readthedocs.org/user_builds/hypertools/checkouts/latest/hypertools/plot/backend.py:1353: UserWarning: Failed to switch to any interactive backend (TkAgg, QtAgg, Qt5Agg, Qt4Agg, GTK4Agg, GTK3Agg, WXAgg). Falling back to 'Agg'.
  warnings.warn(BACKEND_WARNING)
Dataset 13: mean=(54.26, 47.84), sd=(16.77, 26.93), r=-0.07
# Code source: Contextual Dynamics Laboratory
# License: MIT

import math

import matplotlib.pyplot as plt

import hypertools as hyp

datasets = hyp.load('datasaurus')

ncols = 4
nrows = math.ceil(len(datasets) / ncols)
fig, axes = plt.subplots(nrows, ncols, figsize=(3 * ncols, 3 * nrows))
axes = axes.ravel()

for i, (df, ax) in enumerate(zip(datasets, axes)):
    # small black dots via the '.' point marker
    hyp.plot(df, '.', color='k', ndims=2, ax=ax, title=f'Dataset {i + 1}')
    print(f'Dataset {i + 1}: mean=({df.x.mean():.2f}, {df.y.mean():.2f}), '
          f'sd=({df.x.std():.2f}, {df.y.std():.2f}), '
          f'r={df.x.corr(df.y):.2f}')

# hide any unused panels
for ax in axes[len(datasets):]:
    ax.set_visible(False)

plt.tight_layout()
Total running time of the script: (0 minutes 2.961 seconds)