Note
Go to the end to download the full example code.
Nested lists and multilevel styling
 run this example as a notebook — or grab the .ipynb (also linked at the bottom of the page)
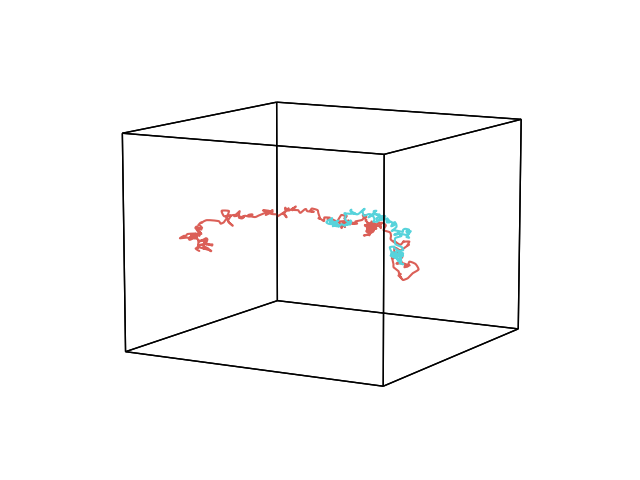
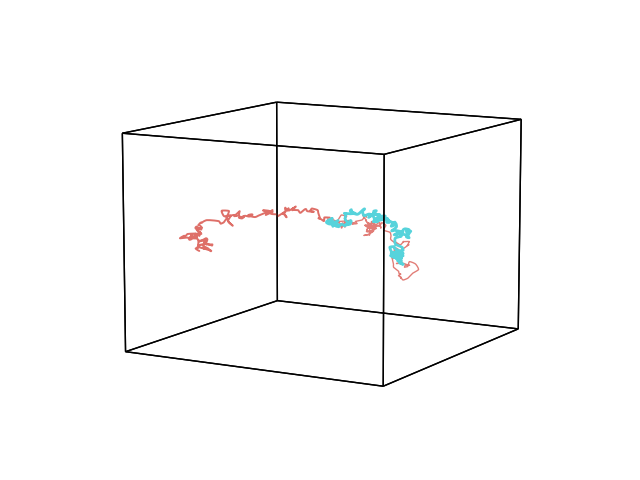
hypertools 1.0 accepts arbitrarily nested lists of datasets. Every dataset under the same outermost group shares that group’s color, and each additional nesting level renders with thinner, fainter lines – a summary-to-detail visual hierarchy. For example, [[a, b], [c]] colors a and b alike (group 1) and c differently (group 2).
/home/docs/checkouts/readthedocs.org/user_builds/hypertools/checkouts/latest/hypertools/plot/backend.py:1353: UserWarning: Failed to switch to any interactive backend (TkAgg, QtAgg, Qt5Agg, Qt4Agg, GTK4Agg, GTK3Agg, WXAgg). Falling back to 'Agg'.
  warnings.warn(BACKEND_WARNING)
/home/docs/checkouts/readthedocs.org/user_builds/hypertools/checkouts/latest/hypertools/plot/backend.py:1353: UserWarning: Failed to switch to any interactive backend (TkAgg, QtAgg, Qt5Agg, Qt4Agg, GTK4Agg, GTK3Agg, WXAgg). Falling back to 'Agg'.
  warnings.warn(BACKEND_WARNING)
# Code source: Contextual Dynamics Lab
# License: MIT

import numpy as np
import hypertools as hyp


def walk(seed):
    return np.cumsum(np.random.default_rng(seed).standard_normal((150, 6)),
                     axis=0)


# two groups: [a, b] vs [c] -- a and b share a color
hyp.plot([[walk(0), walk(1)], [walk(2)]])

# mixed depth: deeper leaves render thinner and fainter
hyp.plot([[walk(0), [walk(1)]], walk(2)])
Total running time of the script: (0 minutes 0.100 seconds)