Note
Go to the end to download the full example code.
Multicolored lines
 run this example as a notebook — or grab the .ipynb (also linked at the bottom of the page)
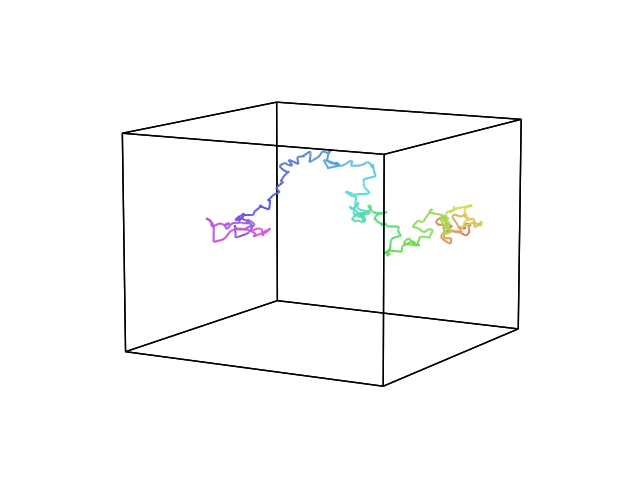
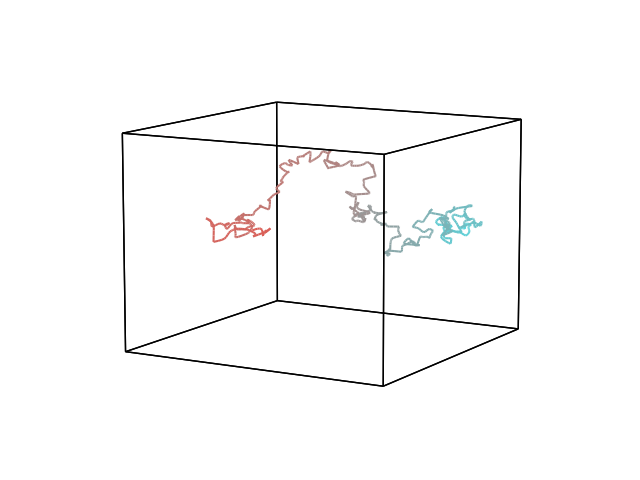
Passing continuous values (or a matrix with one row per observation) as hue together with a line format string colors each trajectory continuously along its length – for example, coloring a trajectory by time, by a behavioral variable, or by mixture proportions. Works on both the matplotlib and plotly backends.
/home/docs/checkouts/readthedocs.org/user_builds/hypertools/checkouts/latest/hypertools/plot/backend.py:1353: UserWarning: Failed to switch to any interactive backend (TkAgg, QtAgg, Qt5Agg, Qt4Agg, GTK4Agg, GTK3Agg, WXAgg). Falling back to 'Agg'.
  warnings.warn(BACKEND_WARNING)
/home/docs/checkouts/readthedocs.org/user_builds/hypertools/checkouts/latest/hypertools/plot/backend.py:1353: UserWarning: Failed to switch to any interactive backend (TkAgg, QtAgg, Qt5Agg, Qt4Agg, GTK4Agg, GTK3Agg, WXAgg). Falling back to 'Agg'.
  warnings.warn(BACKEND_WARNING)
# Code source: Contextual Dynamics Lab
# License: MIT

import numpy as np
import hypertools as hyp

data = np.cumsum(np.random.default_rng(42).standard_normal((300, 8)),
                 axis=0)

# color the trajectory by time
hyp.plot(data, hue=np.arange(len(data), dtype=float))

# color by any per-observation matrix (here: two smoothly varying weights)
weights = np.column_stack([np.linspace(0, 1, len(data)),
                           np.linspace(1, 0, len(data))])
hyp.plot(data, hue=weights)
Total running time of the script: (0 minutes 0.113 seconds)