Note
Go to the end to download the full example code.
Interactive plotting with the plotly backend
 run this example as a notebook — or grab the .ipynb (also linked at the bottom of the page)
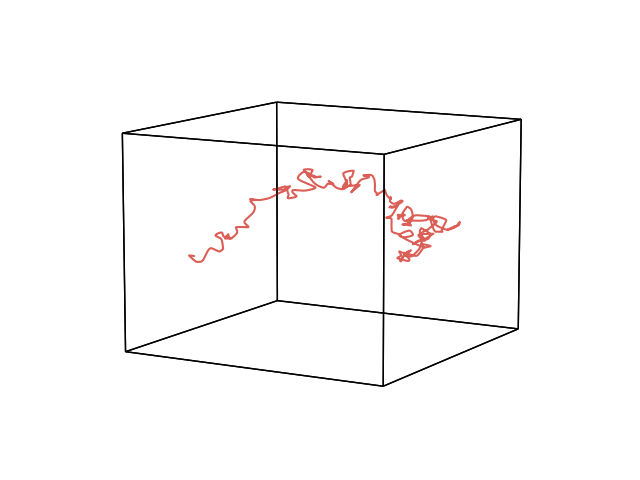
HyperTools 1.0 can render any plot with plotly instead of matplotlib by passing backend=’plotly’ – handy for rotating and zooming 3D plots interactively. With the default backend=’auto’, hypertools automatically uses plotly on Google Colab and Kaggle notebooks (where plotly is preinstalled and interactivity works best) and matplotlib everywhere else, so existing workflows are unchanged. Both backends produce the same styling: colors, line/marker sizes, format strings, and the signature cube frame.
/home/docs/checkouts/readthedocs.org/user_builds/hypertools/checkouts/latest/hypertools/plot/backend.py:1353: UserWarning: Failed to switch to any interactive backend (TkAgg, QtAgg, Qt5Agg, Qt4Agg, GTK4Agg, GTK3Agg, WXAgg). Falling back to 'Agg'.
  warnings.warn(BACKEND_WARNING)
/home/docs/checkouts/readthedocs.org/user_builds/hypertools/checkouts/latest/hypertools/plot/backend.py:1353: UserWarning: Failed to switch to any interactive backend (TkAgg, QtAgg, Qt5Agg, Qt4Agg, GTK4Agg, GTK3Agg, WXAgg). Falling back to 'Agg'.
  warnings.warn(BACKEND_WARNING)
# Code source: Contextual Dynamics Lab
# License: MIT

import numpy as np
import hypertools as hyp

data = np.cumsum(np.random.default_rng(42).standard_normal((200, 10)),
                 axis=0)

# classic matplotlib render (the default outside Colab/Kaggle)
hyp.plot(data, backend='matplotlib')

# identical call, interactive plotly render (in the docs gallery this is
# captured as an image; in a notebook it is fully interactive)
hyp.plot(data, backend='plotly')
Total running time of the script: (0 minutes 24.450 seconds)