Note
Go to the end to download the full example code.
Forecasting timeseries with predict
 run this example as a notebook — or grab the .ipynb (also linked at the bottom of the page)
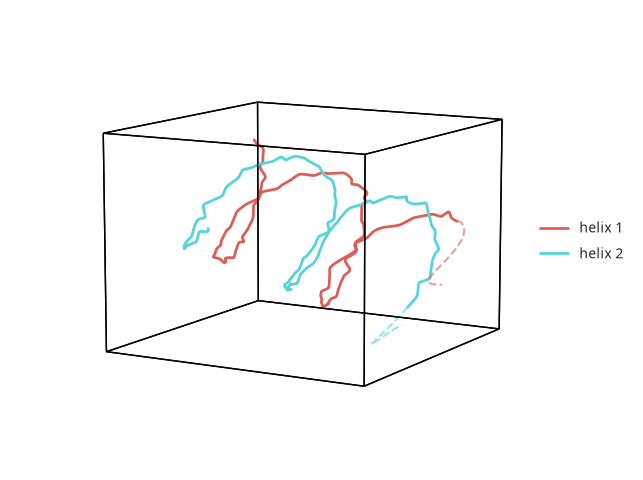
The predict kwarg overlays a forecast on top of your plotted data: a dashed, same-color tail extending t steps past the end of each dataset. Under the hood this calls hypertools.predict, which supports several forecasting models – ‘Kalman’ (a linear-Gaussian state-space filter), ‘GaussianProcess’ (used here), ‘AutoRegressor’ (any sklearn regressor run recursively), ‘ARIMA’, ‘Laplace’, and ‘Chronos’ (a HuggingFace time-series foundation model) – selected via model= when calling hypertools.predict directly. Calling hyp.predict(data, model=…, t=…, return_model=True) also returns the fitted forecaster alongside the forecast, so the same fitted model can be reused (without re-estimating) on new data.
/home/docs/checkouts/readthedocs.org/user_builds/hypertools/checkouts/latest/hypertools/plot/backend.py:1353: UserWarning: Failed to switch to any interactive backend (TkAgg, QtAgg, Qt5Agg, Qt4Agg, GTK4Agg, GTK3Agg, WXAgg). Falling back to 'Agg'.
  warnings.warn(BACKEND_WARNING)
# Code source: Contextual Dynamics Laboratory
# License: MIT

# import
import numpy as np
import hypertools as hyp

# simulate two noisy 5D helical trajectories (phase-shifted): structured
# dynamics like these make the forecast visible -- the dashed tail continues
# each spiral's sweep. (Aperiodic data such as random walks are forecastable
# too, but their best forecast is nearly constant, which is less fun to look
# at.)
np.random.seed(1234)
ts = np.linspace(0, 4 * np.pi, 90)


def helix(phase):
    clean = np.column_stack([
        np.cos(ts + phase), np.sin(ts + phase), ts / 4,
        0.5 * np.cos(2 * ts + phase), 0.5 * np.sin(2 * ts + phase)])
    return clean + np.random.randn(*clean.shape) * 0.03


data = [helix(0.0), helix(2.0)]

# plot, forecasting 30 steps ahead with a Gaussian process; the dashed,
# same-color tails are the forecasts
hyp.plot(data, predict='GaussianProcess', t=30,
         legend=['helix 1', 'helix 2'], linewidth=2)
Total running time of the script: (0 minutes 0.189 seconds)