A DataGeometry object or “geo”
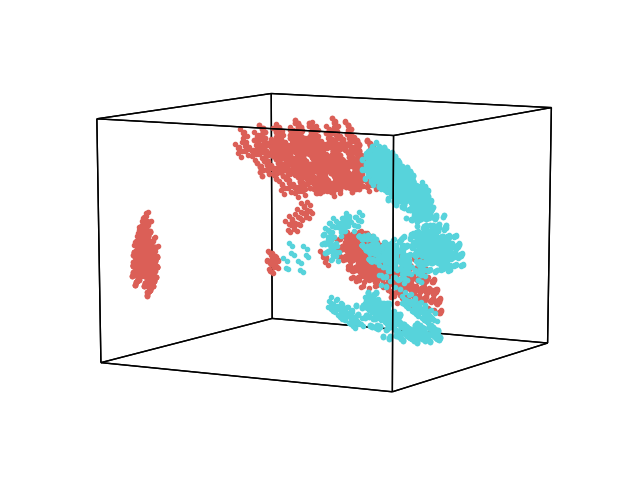
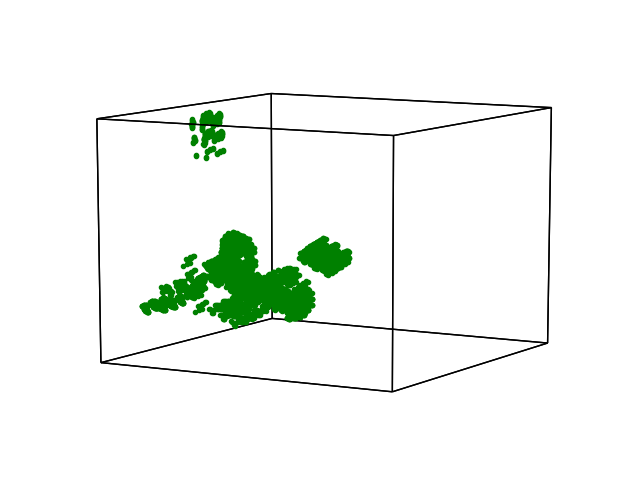
When the plot function is called, it returns a DataGeometry object, or geo. A geo contains all the pieces needed to regenerate the plot. You can use the geo plot method to evaluate the same plot with new arguments, like changing the color of the points, or trying a different normalization method. To save the plot, simply call geo.save(fname), where fname is a file name/path. Then, this file can be reloaded using hyp.load to be plotted again at another time. Finally, the transform method can be used to transform new data using the same transformations that were applied to the geo.
# Code source: Andrew Heusser
# License: MIT

# import
import hypertools as hyp

# load some data
geo = hyp.load('mushrooms')

# plot
t = geo.plot()

# replot with new parameters
geo.plot(normalize='within', color='green')

# save the object
# geo.save('test')

# load it back in
# geo = hyp.load('test.geo')

# transform some new data
# transformed_data = geo.transform(data)

# transform some 'new' data and plot it
# hyp.plot(transformed_data, '.')

# get a copy of the data
# geo.get_data()

# get the formatted data
# geo.get_formatted_data()
Total running time of the script: ( 0 minutes 0.455 seconds)

