Note
Go to the end to download the full example code.
Colorbars
 run this example as a notebook — or grab the .ipynb (also linked at the bottom of the page)
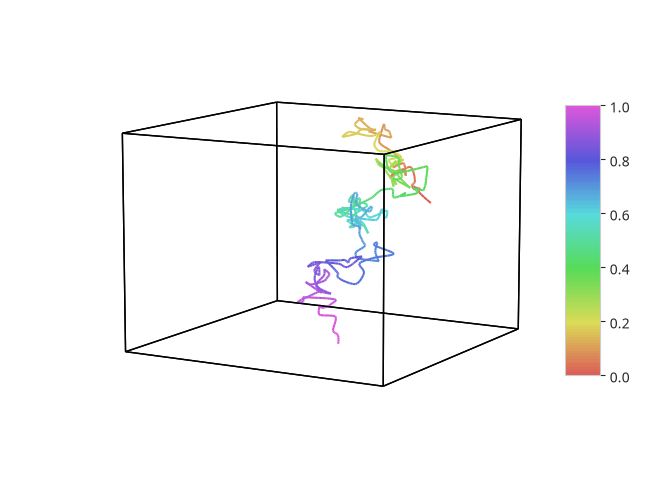
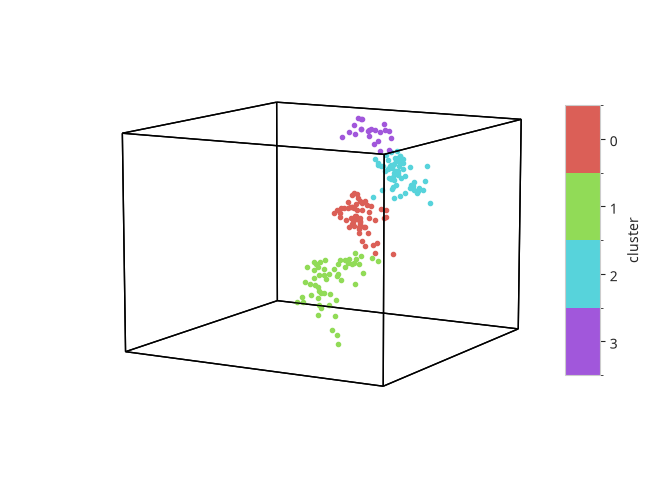
The colorbar kwarg draws a colorbar reflecting whatever color mapping is already in use (GH #100). For a continuous hue, the colorbar is a continuous gradient spanning the actual value range. For discrete groups (categorical hue, cluster/n_clusters, or a plain list of datasets), the colorbar is segmented into one block per group, labeled the same way the legend would be.
# Code source: Contextual Dynamics Laboratory
# License: MIT

import numpy as np

import hypertools as hyp

rng = np.random.default_rng(2)
data = rng.standard_normal((200, 3)).cumsum(axis=0)

# continuous hue: a colorbar spanning the actual value range
hue = np.linspace(0, 1, len(data))
hyp.plot(data, '-', hue=hue, colorbar=True)
/home/docs/checkouts/readthedocs.org/user_builds/hypertools/checkouts/latest/hypertools/plot/backend.py:1353: UserWarning: Failed to switch to any interactive backend (TkAgg, QtAgg, Qt5Agg, Qt4Agg, GTK4Agg, GTK3Agg, WXAgg). Falling back to 'Agg'.
  warnings.warn(BACKEND_WARNING)
Discrete groups (here, k-means clusters) get a segmented colorbar with one tick/block per group instead of a continuous gradient. A dict lets you set a label or move the colorbar to another side of the figure.
/home/docs/checkouts/readthedocs.org/user_builds/hypertools/checkouts/latest/hypertools/plot/backend.py:1353: UserWarning: Failed to switch to any interactive backend (TkAgg, QtAgg, Qt5Agg, Qt4Agg, GTK4Agg, GTK3Agg, WXAgg). Falling back to 'Agg'.
  warnings.warn(BACKEND_WARNING)
Total running time of the script: (0 minutes 0.292 seconds)