Note
Go to the end to download the full example code.
Discovering clusters
 run this example as a notebook — or grab the .ipynb (also linked at the bottom of the page)
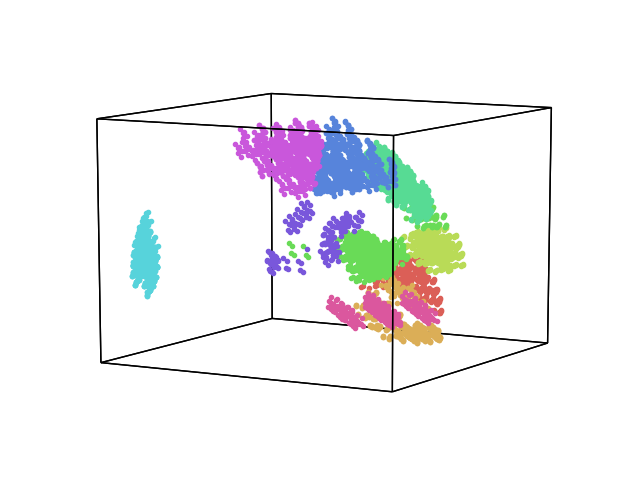
The n_clusters kwarg can be used to discover clusters in your dataset. It relies on scikit-learn’s implementation of k-means clustering to find clusters, and then labels the points accordingly. You must set the number of clusters yourself. Because the rows of the mushrooms dataset are unordered samples, we plot them as points (the ‘.’ format string) rather than as a connected line.
/home/docs/checkouts/readthedocs.org/user_builds/hypertools/checkouts/latest/hypertools/plot/backend.py:1353: UserWarning: Failed to switch to any interactive backend (TkAgg, QtAgg, Qt5Agg, Qt4Agg, GTK4Agg, GTK3Agg, WXAgg). Falling back to 'Agg'.
  warnings.warn(BACKEND_WARNING)
Total running time of the script: (0 minutes 1.615 seconds)