Note
Go to the end to download the full example code.
Imputing missing data: PPCA vs Kalman smoothing
 run this example as a notebook — or grab the .ipynb (also linked at the bottom of the page)
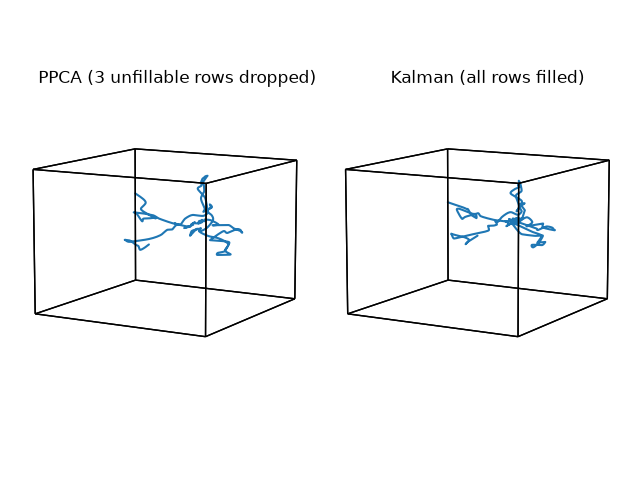
Hypertools fills missing (NaN) values via hypertools.impute before reducing/plotting. This compares two imputers on the weights_avg dataset after randomly knocking out 10% of its entries – plus three CONSECUTIVE rows where every feature is missing. That fully-missing-row case is the motivating example for GH #169: PPCA reconstructs a row from its own observed features, so a row with NO observed features at all cannot be recovered, so PPCA warns and leaves those rows NaN (they are dropped below purely so the PPCA panel has something plottable). The Kalman imputer instead smooths across time, so it can fill a fully-missing row from the neighboring (observed) timepoints, at the cost of assuming the data are a reasonably smooth timeseries – its panel keeps every row.
/home/docs/checkouts/readthedocs.org/user_builds/hypertools/checkouts/latest/examples/plot_impute.py:44: UserWarning: PPCA cannot fill 3 row(s) with no observed features at all; those rows will remain NaN. Use model='Kalman' (hypertools.impute.kalman.Kalman) to fill fully-missing rows too (see GH #169).
  ppca_imputed = hyp.impute(missing, model='PPCA')
/home/docs/checkouts/readthedocs.org/user_builds/hypertools/checkouts/latest/hypertools/external/ppca.py:156: RuntimeWarning: divide by zero encountered in log
  det = np.log(np.linalg.det(Sx))
/home/docs/checkouts/readthedocs.org/user_builds/hypertools/checkouts/latest/hypertools/plot/backend.py:1353: UserWarning: Failed to switch to any interactive backend (TkAgg, QtAgg, Qt5Agg, Qt4Agg, GTK4Agg, GTK3Agg, WXAgg). Falling back to 'Agg'.
  warnings.warn(BACKEND_WARNING)
/home/docs/checkouts/readthedocs.org/user_builds/hypertools/checkouts/latest/hypertools/plot/backend.py:1353: UserWarning: Failed to switch to any interactive backend (TkAgg, QtAgg, Qt5Agg, Qt4Agg, GTK4Agg, GTK3Agg, WXAgg). Falling back to 'Agg'.
  warnings.warn(BACKEND_WARNING)
# Code source: Contextual Dynamics Laboratory
# License: MIT

# import
import numpy as np
import matplotlib.pyplot as plt
import hypertools as hyp

# load example data and knock out some values
np.random.seed(42)
data = hyp.load('weights_avg')[0]
missing = data.copy()
n_rows, n_cols = missing.shape

# randomly remove 10% of the entries
n_missing = int(0.1 * n_rows * n_cols)
flat_inds = np.random.choice(n_rows * n_cols, size=n_missing, replace=False)
rows, cols = np.unravel_index(flat_inds, (n_rows, n_cols))
missing[rows, cols] = np.nan

# knock out 3 consecutive fully-missing rows (the GH #169 case)
missing[40:43, :] = np.nan

# impute with PPCA (cannot fill the fully-NaN rows) and Kalman (can)
ppca_imputed = hyp.impute(missing, model='PPCA')
kalman_imputed = hyp.impute(missing, model='Kalman')

# PPCA cannot reconstruct rows with zero observed features, so those 3 rows
# come back as NaN; drop them before plotting (there is nothing left to
# reduce/plot for that timepoint). Kalman fills every row, so nothing to drop.
ppca_plottable = ppca_imputed.dropna(axis=0, how='all')

# plot side by side
fig, axes = plt.subplots(1, 2, subplot_kw={'projection': '3d'})
hyp.plot(ppca_plottable, ax=axes[0],
         title=f'PPCA ({n_rows - len(ppca_plottable)} unfillable rows dropped)')
hyp.plot(kalman_imputed, ax=axes[1], title='Kalman (all rows filled)')
plt.tight_layout()
plt.show()
Total running time of the script: (0 minutes 18.818 seconds)