Note
Go to the end to download the full example code.
MultiIndex DataFrames
 run this example as a notebook — or grab the .ipynb (also linked at the bottom of the page)
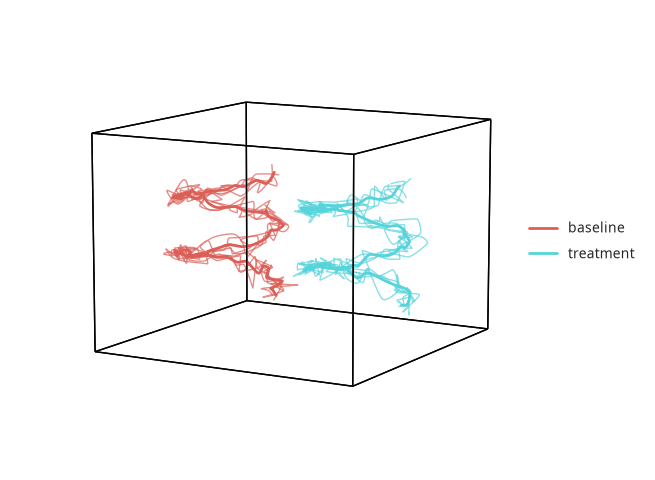
A DataFrame with a row MultiIndex (2 or more levels) is automatically expanded by hyp.plot into one “leaf” trace per unique index combination, plus one thicker, more opaque “mean” trace per level of grouping above the leaves (GH #95). Color is assigned by the top-level index value; leaves are thin and faint, and each successive level of averaging gets a thicker line and higher alpha, up to a fully opaque top-level mean that also carries the legend label.
/home/docs/checkouts/readthedocs.org/user_builds/hypertools/checkouts/latest/hypertools/plot/backend.py:1353: UserWarning: Failed to switch to any interactive backend (TkAgg, QtAgg, Qt5Agg, Qt4Agg, GTK4Agg, GTK3Agg, WXAgg). Falling back to 'Agg'.
  warnings.warn(BACKEND_WARNING)
# Code source: Contextual Dynamics Laboratory
# License: MIT

import numpy as np
import pandas as pd

import hypertools as hyp

rng = np.random.default_rng(3)

# 2 conditions x 4 subjects, each a noisy 3D helix (offset per condition)
n_time = 60
t = np.linspace(0, 4 * np.pi, n_time)
tuples, rows = [], []
for ci, cond in enumerate(['baseline', 'treatment']):
    for si in range(4):
        subj = f'subj{si}'
        noise = rng.standard_normal((n_time, 3)) * 0.15
        helix = np.column_stack([np.cos(t), np.sin(t), t / 4]) + noise
        helix[:, 0] += ci * 3.0
        rows.append(helix)
        tuples.extend([(cond, subj)] * n_time)

data = np.vstack(rows)
index = pd.MultiIndex.from_tuples(tuples, names=['condition', 'subject'])
df = pd.DataFrame(data, columns=['x', 'y', 'z'], index=index)

# leaf traces (one per condition x subject, thin + faint) plus a thick,
# fully opaque mean trace per condition -- colored by condition, with only
# the condition-level means shown in the legend
hyp.plot(df, legend=True)
Total running time of the script: (0 minutes 0.133 seconds)