Normalization
The normalize is a helper function to z-score your data. This is
useful if your features (columns) are scaled differently within or
across datasets. By default, hypertools normalizes across the columns
of all datasets passed, but also affords the option to normalize columns
within individual lists. Alternatively, you can also normalize each
row. The function returns an array or list of arrays where the columns
or rows are z-scored (output type same as input type).
Import packages
import hypertools as hyp
import numpy as np

%matplotlib inline
Generate synthetic data
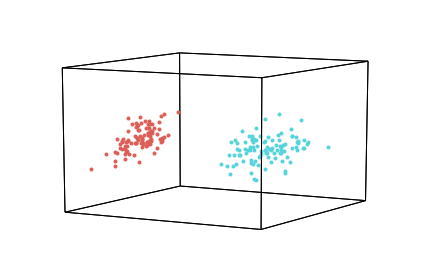
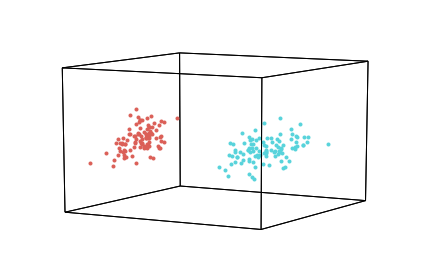
First, we generate two sets of synthetic data. We pull points randomly from a multivariate normal distribution for each set, so the sets will exhibit unique statistical properties.
x1 = np.random.randn(10,10)
x2 = np.random.randn(10,10)

c1 = np.dot(x1, x1.T)
c2 = np.dot(x2, x2.T)

m1 = np.zeros([1,10])
m2 = 10 + m1

data1 = np.random.multivariate_normal(m1[0], c1, 100)
data2 = np.random.multivariate_normal(m2[0], c2, 100)

data = [data1, data2]
Normalizing (Specified Cols or Rows)
Or, to specify a different normalization, pass one of the following arguments as a string, as shown in the examples below.
‘across’ - columns z-scored across passed lists (default)
‘within’ - columns z-scored within passed lists
‘row’ - rows z-scored
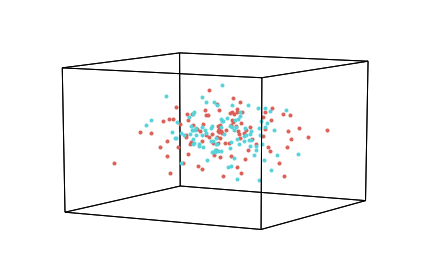
Normalizing ‘across’
When you normalize ‘across’, all of the data is stacked/combined, and the normalization is done on the columns of the full dataset. Then the data is split back into separate elements.
norm = hyp.normalize(data, normalize = 'across')
geo = hyp.plot(norm, '.')

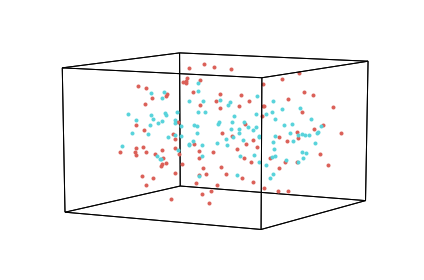
Normalizing ‘within’
When you normalize ‘within’, normalization is done on the columns of each element of the data, separately.
norm = hyp.normalize(data, normalize = 'within')
geo = hyp.plot(norm, '.')


