Note
Go to the end to download the full example code.
Autoencoder reducers
 run this example as a notebook — or grab the .ipynb (also linked at the bottom of the page)
hyp.reduce supports six torch-backed autoencoder reducers (GH #162):
Autoencoder (shallow), SparseAutoencoder, DeepAutoencoder,
ConvolutionalAutoencoder, SequenceAutoencoder, and
VariationalAutoencoder. They are used exactly like any other reduce=
model – by name, with parameters passed via the dict spec – and require
the optional torch dependency (pip install "hypertools[torch]").
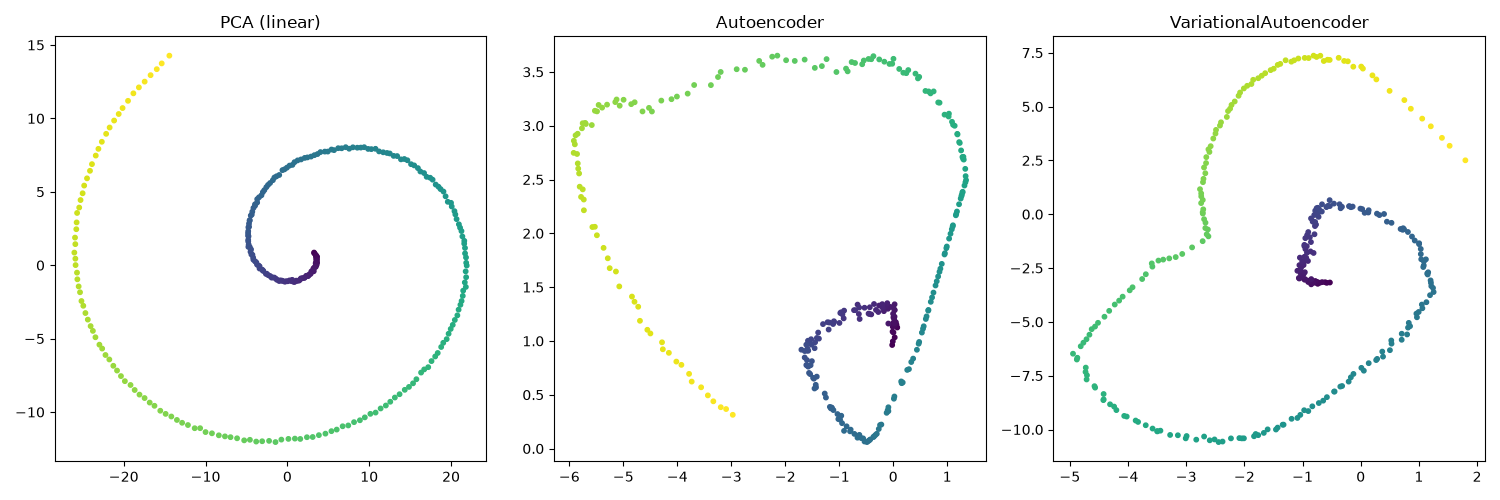
This example fits a shallow Autoencoder and a VariationalAutoencoder on
the same data and compares them against PCA.
# Code source: Contextual Dynamics Laboratory
# License: MIT

import numpy as np
import matplotlib.pyplot as plt
import hypertools as hyp

rng = np.random.default_rng(0)
# a nonlinear 2D manifold (a Swiss-roll-like spiral) embedded in 10D, plus
# noise -- autoencoders can unfold nonlinear structure that PCA (linear)
# cannot
t = np.linspace(0, 3 * np.pi, 300)
manifold = np.column_stack([t * np.cos(t), t * np.sin(t)])
projection = rng.standard_normal((2, 10))
data = manifold @ projection + 0.05 * rng.standard_normal((300, 10))

# a small, fast training budget -- plenty for a gallery example on 10D data
ae_kwargs = {'epochs': 30, 'batch_size': 32, 'random_state': 0}

# the VAE needs a longer budget and a small KL weight: with the default
# kl_weight=1.0 the KL term dominates on a tiny dataset and the latent
# space collapses to a point (a classic VAE failure mode)
vae_kwargs = {'epochs': 100, 'batch_size': 32, 'random_state': 0,
              'kl_weight': 0.001}

pca_out = hyp.reduce(data, reduce='PCA', ndims=2)
ae_out = hyp.reduce(
    data, reduce={'model': 'Autoencoder', 'kwargs': ae_kwargs}, ndims=2)
vae_out = hyp.reduce(
    data,
    reduce={'model': 'VariationalAutoencoder', 'kwargs': vae_kwargs},
    ndims=2)

fig, axes = plt.subplots(1, 3, figsize=(15, 5))
for ax, (name, out) in zip(
        axes, [('PCA (linear)', pca_out), ('Autoencoder', ae_out),
               ('VariationalAutoencoder', vae_out)]):
    ax.scatter(out[:, 0], out[:, 1], c=t, cmap='viridis', s=10)
    ax.set_title(name)
plt.tight_layout()
Total running time of the script: (0 minutes 4.663 seconds)