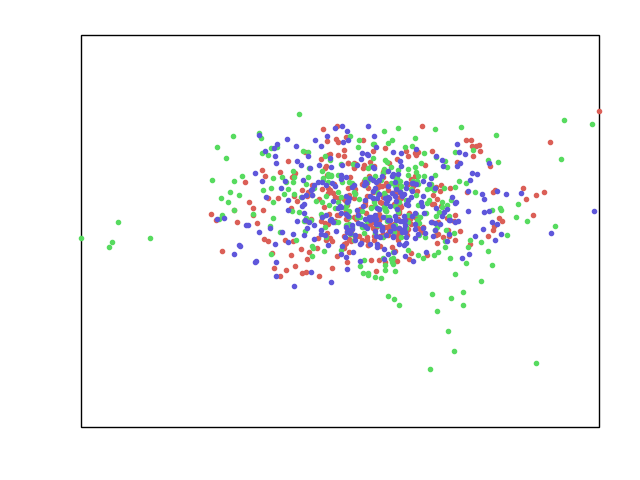
A 2D Plot
A 2D plot can be created by setting ndims=2.

# Code source: Andrew Heusser
# License: MIT

# import
import hypertools as hyp

# load data
geo = hyp.load('weights_sample')

# plot
geo.plot(fmt='.', ndims=2)
Total running time of the script: ( 0 minutes 0.136 seconds)