Note
Go to the end to download the full example code.
Visualizing the digits dataset using UMAP
 run this example as a notebook — or grab the .ipynb (also linked at the bottom of the page)
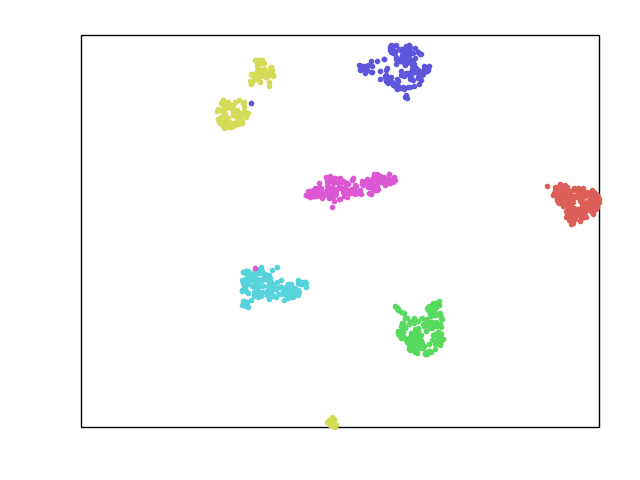
This example loads in some data from the scikit-learn digits dataset and plots it using UMAP, with one color per digit class and a legend mapping colors to digits.
/home/docs/checkouts/readthedocs.org/user_builds/hypertools/checkouts/latest/hypertools/plot/backend.py:1353: UserWarning: Failed to switch to any interactive backend (TkAgg, QtAgg, Qt5Agg, Qt4Agg, GTK4Agg, GTK3Agg, WXAgg). Falling back to 'Agg'.
  warnings.warn(BACKEND_WARNING)
Total running time of the script: (0 minutes 32.875 seconds)