Note
Go to the end to download the full example code.
Aligning matrices to a common space
 run this example as a notebook — or grab the .ipynb (also linked at the bottom of the page)
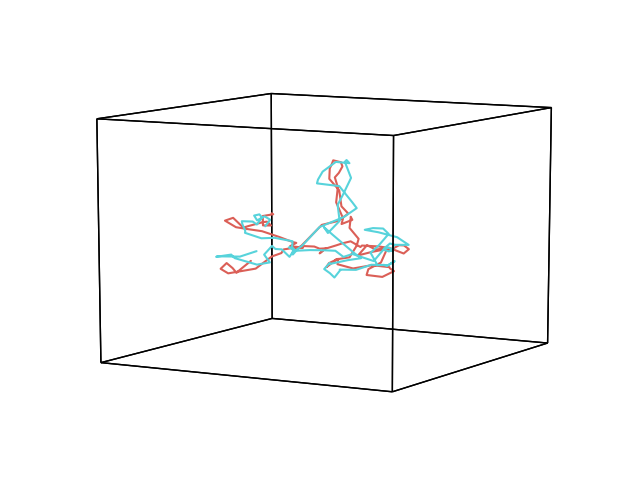
In this example, we plot the trajectory of multivariate brain activity for two groups of subjects that have been hyperaligned (Haxby et al, 2011). First, we use the align tool to project all subjects in the list to a common space. Then we average the data into two groups, and plot.
/home/docs/checkouts/readthedocs.org/user_builds/hypertools/checkouts/latest/examples/plot_align.py:22: DeprecationWarning: model='hyper' is a deprecated alias for 'HyperAlign'; pass model='HyperAlign' instead.
  data = hyp.align(data, model='hyper')
/home/docs/checkouts/readthedocs.org/user_builds/hypertools/checkouts/latest/hypertools/plot/backend.py:1353: UserWarning: Failed to switch to any interactive backend (TkAgg, QtAgg, Qt5Agg, Qt4Agg, GTK4Agg, GTK3Agg, WXAgg). Falling back to 'Agg'.
  warnings.warn(BACKEND_WARNING)
# Code source: Andrew Heusser
# License: MIT

# import
import hypertools as hyp
import numpy as np

# load example data
data = hyp.load('weights')
data = hyp.align(data, model='hyper')

# average into two equal groups (18 subjects each)
group1 = np.mean(data[:18], 0)
group2 = np.mean(data[18:], 0)

# plot
hyp.plot([group1[:100, :], group2[:100, :]])
Total running time of the script: (0 minutes 4.360 seconds)