Note
Go to the end to download the full example code.
Plotting State of the Union Addresses
 run this example as a notebook — or grab the .ipynb (also linked at the bottom of the page)
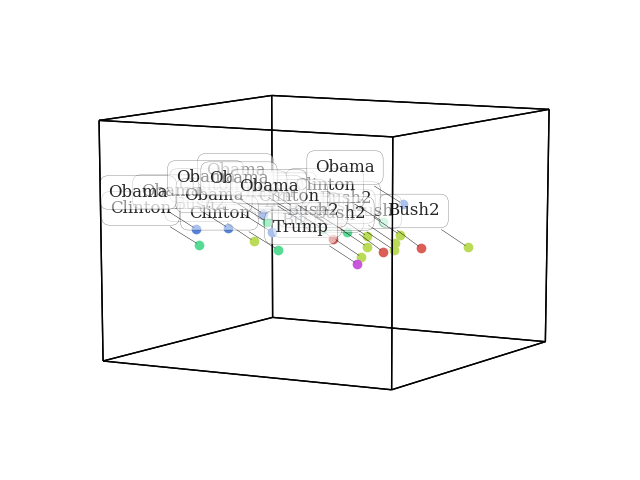
hyp.load(‘sotus’) returns the full text of the 29 State of the Union addresses delivered between 1989 and 2018, in chronological order. Passing the raw speech texts straight to hyp.plot runs hypertools’ default text pipeline: each address is converted to a vector of word counts, modeled with a 50-topic Latent Dirichlet Allocation model fit to a large sample of wikipedia pages, and reduced to 3 dimensions. Because the addresses are plotted in chronological order, the connected line traces a “text trajectory” through semantic space: addresses that emphasize similar themes land near one another, and the trajectory shows how the topics presidents discuss have drifted over three decades.
29 State of the Union addresses loaded
/home/docs/checkouts/readthedocs.org/user_builds/hypertools/checkouts/latest/hypertools/plot/backend.py:1353: UserWarning: Failed to switch to any interactive backend (TkAgg, QtAgg, Qt5Agg, Qt4Agg, GTK4Agg, GTK3Agg, WXAgg). Falling back to 'Agg'.
  warnings.warn(BACKEND_WARNING)
# Code source: Andrew Heusser
# License: MIT

# load hypertools
import hypertools as hyp

# load the State of the Union addresses: 29 speeches (1989-2018), in
# chronological order
speeches = hyp.load('sotus')
print(f'{len(speeches)} State of the Union addresses loaded')

# plot the trajectory through semantic space
hyp.plot(speeches)
Total running time of the script: (0 minutes 2.413 seconds)