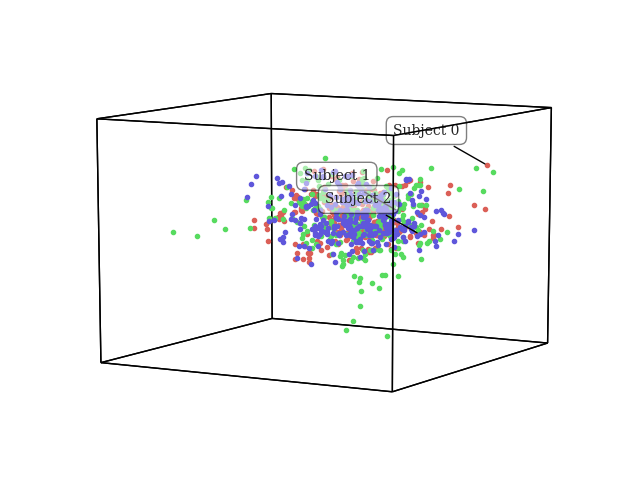
Labeling your datapoints
This is an example of how to use the label(s) kwarg, which must be a list the length of the number of datapoints (rows) you have in the matrix. Here, we are simply labeling the first datapoint for each matrix in the list.
# Code source: Andrew Heusser
# License: MIT

# import
import hypertools as hyp
import numpy as np

# load example data
geo = hyp.load('weights_sample')
data = geo.get_data()

# simulate labels
labels=[]
for idx,i in enumerate(data):
    tmp=[]
    for iidx,ii in enumerate(i):
        if iidx==0:
            tmp.append('Subject ' + str(idx))
        else:
            tmp.append(None)
    labels.append(tmp)

# plot
geo.plot(fmt='.', labels=labels)
Total running time of the script: ( 0 minutes 0.136 seconds)