A basic example
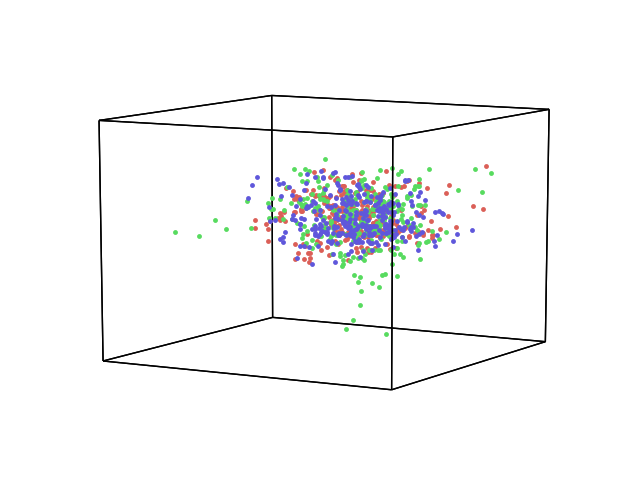
Here is a basic example where we load in some data (a list of arrays - samples by features), take the first two arrays in the list and plot them as points with the ‘o’. Hypertools can handle all format strings supported by matplotlib.
# Code source: Andrew Heusser
# License: MIT

# import
import hypertools as hyp

# load example data
geo = hyp.load('weights_sample')

# plot
geo.plot(fmt='.')
Total running time of the script: ( 0 minutes 0.114 seconds)