Using describe to evaluate the integrity of your visualization
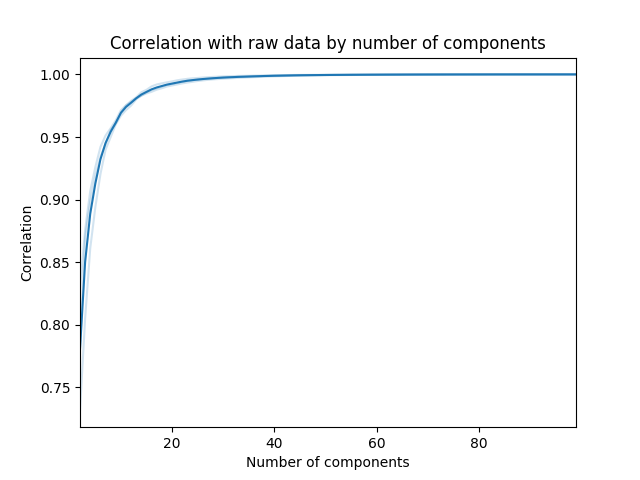
The downside to using dimensionality reduction to visualize your data is that some variance will likely be removed. To help get a sense for the integrity of your low dimensional visualizations, we built the describe function, which computes the covariance (samples by samples) of both the raw and reduced datasets, and plots their correlation.
# Code source: Andrew Heusser
# License: MIT

# import
import hypertools as hyp
import numpy as np

# load example data
geo = hyp.load('weights_sample')
data = geo.get_data()

# plot
hyp.describe(data)
Total running time of the script: ( 0 minutes 10.424 seconds)