Alignment
The align function projects 2 or more datasets with different
coordinate systems into a common space. By default it uses the
hyperalignment algorithm (Haxby et al,
2011), but
also provides the option to use the Shared Response Model (SRM) for
alignment, if preferred, via the Brain Imaging Analysis Kit
(brainiak).
Alignment can be particularly useful in exploring statistical properties and/or similarities of datasets that are not in the same coordinate system (such as fMRI data from visual areas of participants watching a movie, and the movie data itself).
Alignment algorithms use linear transformations to rotate and scale your datasets so they match as best as possible. For example, take these three distinct datasets. Each has a similar shape (an S), but are scaled and rotated differently. Aligning these datasets finds the transformation that minimizes the distance between them.
Import Hypertools
import hypertools as hyp
import numpy as np

%matplotlib inline
Load your data
First, we’ll load one of the sample datasets. This dataset is a list of
2 numpy arrays, each containing average brain activity (fMRI) from
18 subjects listening to the same story, fit using Hierarchical
Topographic Factor Analysis (HTFA) with 100 nodes. The rows are
timepoints and the columns are fMRI components.
See the full dataset or the HTFA article for more info on the data and HTFA, respectively.
data = hyp.load('weights').get_data()
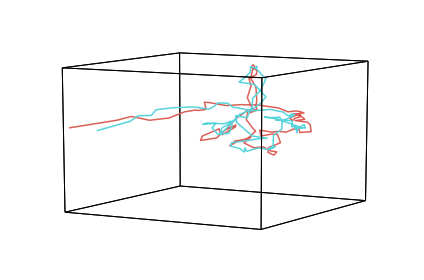
Visualize unaligned data
First, we can see how the first hundred data points from two arrays in the weights data look when plotted together.
# average into two groups
group1 = np.mean(data[:17], 0)
group2 = np.mean(data[18:], 0)

# plot
geo = hyp.plot([group1[:100, :], group2[:100, :]])
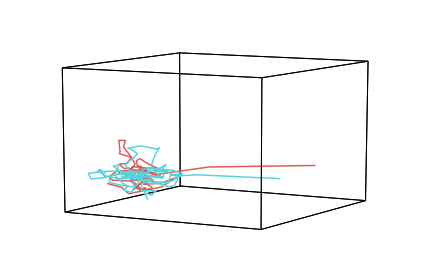
Aligning data with Hyperalignment
Next, we can align the two datasets (using hyperalignment) and visualize the aligned data. Note that the two datasets are now much more similar to each other.
aligned_data = hyp.align(data)

# average into two groups
group1 = np.mean(aligned_data[:17], 0)
group2 = np.mean(aligned_data[18:], 0)

# plot
geo = hyp.plot([group1[:100, :], group2[:100, :]])
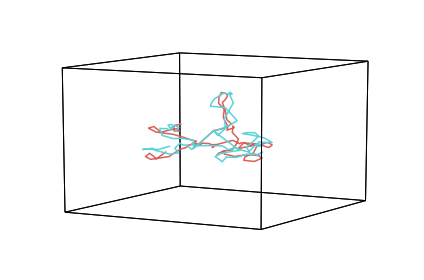
Aligning data with the Shared Response Model
You may use the Shared Response Model
for alignment by setting align to ‘SRM’.
aligned_data = hyp.align(data, align='SRM')

# average into two groups
group1 = np.mean(aligned_data[:17], 0)
group2 = np.mean(aligned_data[18:], 0)

# plot
geo = hyp.plot([group1[:100, :], group2[:100, :]])