Contents Menu Expand Light mode Dark mode Auto light/dark, in light mode Auto light/dark, in dark mode Skip to content
hypertools
hypertools

Contents:

  • API reference
    • hypertools.load
    • hypertools.save
    • hypertools.impute
    • hypertools.manip
    • hypertools.normalize
    • hypertools.reduce
    • hypertools.reduce.autoencoders.Autoencoder
    • hypertools.reduce.autoencoders.SparseAutoencoder
    • hypertools.reduce.autoencoders.DeepAutoencoder
    • hypertools.reduce.autoencoders.ConvolutionalAutoencoder
    • hypertools.reduce.autoencoders.SequenceAutoencoder
    • hypertools.reduce.autoencoders.VariationalAutoencoder
    • hypertools.align
    • hypertools.align.procrustes
    • hypertools.align.score.alignment_score
    • hypertools.cluster
    • hypertools.predict
    • hypertools.plot
    • hypertools.subplots
    • hypertools.HyperAnimation
    • hypertools.FrameContext
    • hypertools.set_interactive_backend
    • hypertools.set_autoinstall
    • hypertools.analyze
    • hypertools.apply_model
    • hypertools.supported_models
    • hypertools.Pipeline
    • hypertools.describe
    • hypertools.tools.text2mat
    • hypertools.tools.gensim_models.Word2VecVectorizer
    • hypertools.tools.gensim_models.Doc2VecVectorizer
    • hypertools.tools.gensim_models.FastTextVectorizer
    • hypertools.tools.gensim_models.LdaVectorizer
    • hypertools.tools.gensim_models.LsiVectorizer
    • hypertools.tools.gensim_models.HdpVectorizer
    • hypertools.io.lsl_stream
    • hypertools.io.LSLStream
    • hypertools.io.synthetic_outlet
    • hypertools.HypertoolsError
    • hypertools.HypertoolsBackendError
    • hypertools.HypertoolsIOError
    • hypertools.HypertoolsOfflineError
    • hypertools.HypertoolsTrustError
    • hypertools.text_windows
    • hypertools.damage
    • hypertools.stack
    • hypertools.tools.format_data
    • hypertools.tools.missing_inds
    • hypertools.tools.df2mat
  • The canonical pipeline order
  • Hierarchical DataFrames
  • Animating plots
  • Optional dependencies
  • How to use HyperTools
    • Plotting
    • Analyze
    • Normalization
    • Dimensionality reduction
    • Alignment
    • Clustering with Hypertools
    • Loading and saving data with hyp.load and hyp.save
    • Manipulating data with hyp.manip, and animating windows and trails
    • Fitted models and pipelines: return_model=True, .transform, pipeline=, apply_model and Pipeline
    • Hierarchical DataFrames: plotting and forecasting a column MultiIndex
    • Forecasting three regions’ weather while it is drawn
    • Visualizing text
    • News headlines in embedding space: a Hugging Face dataset meets sentence transformers
    • Modern scikit-learn models and dynamical systems
    • Mapping Wikipedia with modern text embeddings
    • Reddit thread trajectories: one stroke per utterance, one color per speaker
    • Plotting streaming data
    • Streaming from a Lab Streaming Layer (LSL) device
    • Forecasting stock prices with hyp.predict
    • Imputing and forecasting a real projectile arc with hyp.impute and hyp.predict
    • A quarter century of the market: six sectors, one space
    • A century of weather: twenty cities as twenty features, one hot path
    • The shape of a conversation: one path per turn, colored by its speaker
    • Five paintings, described in words, drawn in their own colors
    • Morphing through the shapes zoo, with titles
  • Gallery of Examples
    • A basic example
    • A 2D Plot
    • Plotting a Pandas Dataframe
    • Nested lists and multilevel styling
    • MultiIndex DataFrames
    • Working with plot outputs (figures & fitted models)
    • Saving a plot
    • Explore mode!
    • Interactive plotting with the plotly backend
    • Grouping data by category
    • Generating a legend
    • Labeling your datapoints
    • Colorbars
    • Multicolored lines
    • Density shading
    • Surfaces around point clouds
    • Visualizing the digits dataset
    • Autoencoder reducers
    • Using describe to evaluate the integrity of your visualization
    • The Datasaurus Dozen
    • A tour of hyp.load’s data sources
    • A zoo of 3D shapes
    • Normalizing your features
    • Aligning matrices to a common space
    • Aligning two matrices with Procrustes
    • Analyze data and then plot
    • Applying models with apply_model
    • Fit once, reuse: pipelines and return_model
    • Discovering clusters
    • Soft clustering with mixture models
    • Plotting data with missing values
    • Imputing missing data: PPCA vs Kalman smoothing
    • Forecasting timeseries with predict
    • Plotting text
    • Defining a custom corpus for plotting text
    • Plotting State of the Union Addresses
    • Gensim text models
    • Animated plots
    • Create a rotating static plot
    • Trails: chemtrails and precognition
    • Mixing trail styles per dataset
    • Saving an animation
    • Animated interactive plots (plotly backend)
    • Story trajectories: brain activity while listening to a story
    • Morphing through the shapes zoo, with titles
    • Morphing hull surfaces through shapes
    • The shape of a conversation: one path per turn, colored by its speaker
    • Five paintings, described in words, drawn in their own colors
    • A quarter century of the market: six sectors, one space
    • A century of weather: twenty cities as twenty features, one hot path
    • Forecasting three regions’ weather while it is drawn
Back to top
View this page
Edit this page

Gallery of Examples
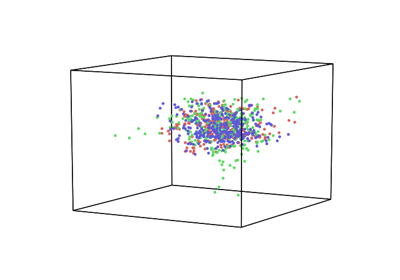
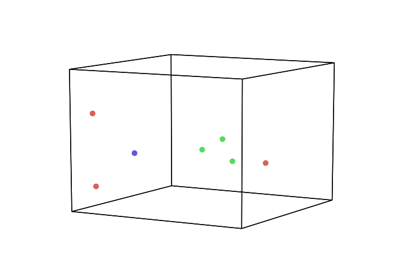
A basic example

A basic example

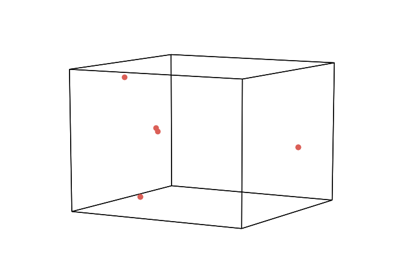
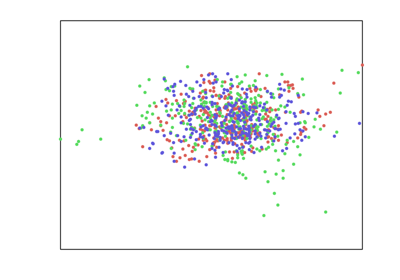
A 2D Plot

A 2D Plot

Plotting a Pandas Dataframe

Plotting a Pandas Dataframe

Nested lists and multilevel styling

Nested lists and multilevel styling

MultiIndex DataFrames

MultiIndex DataFrames

Working with plot outputs (figures & fitted models)

Working with plot outputs (figures & fitted models)

Saving a plot

Saving a plot

Explore mode!

Explore mode!

Interactive plotting with the plotly backend

Interactive plotting with the plotly backend

Grouping data by category

Grouping data by category

Generating a legend

Generating a legend

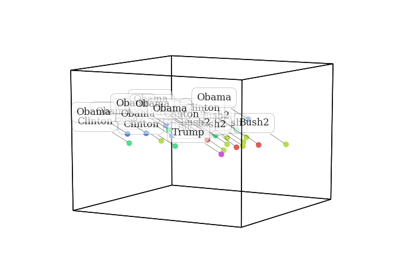
Labeling your datapoints

Labeling your datapoints

Colorbars

Colorbars

Multicolored lines

Multicolored lines

Density shading

Density shading

Surfaces around point clouds

Surfaces around point clouds

Visualizing the digits dataset

Visualizing the digits dataset

Autoencoder reducers

Autoencoder reducers

Using describe to evaluate the integrity of your visualization

Using describe to evaluate the integrity of your visualization

The Datasaurus Dozen

The Datasaurus Dozen

A tour of hyp.load’s data sources

A tour of hyp.load's data sources

A zoo of 3D shapes

A zoo of 3D shapes

Normalizing your features

Normalizing your features

Aligning matrices to a common space

Aligning matrices to a common space

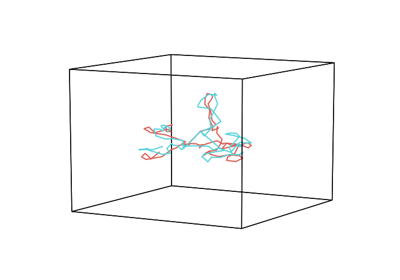
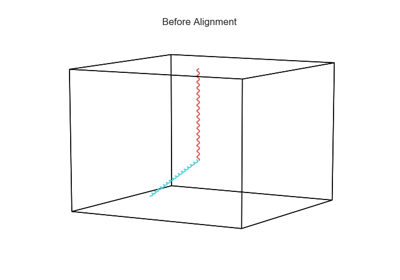
Aligning two matrices with Procrustes

Aligning two matrices with Procrustes

Analyze data and then plot

Analyze data and then plot

Applying models with apply_model

Applying models with apply_model

Fit once, reuse: pipelines and return_model

Fit once, reuse: pipelines and return_model

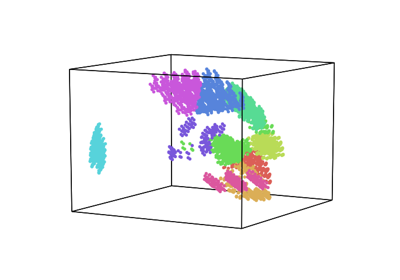
Discovering clusters

Discovering clusters

Soft clustering with mixture models

Soft clustering with mixture models

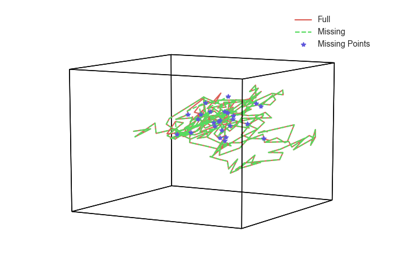
Plotting data with missing values

Plotting data with missing values

Imputing missing data: PPCA vs Kalman smoothing

Imputing missing data: PPCA vs Kalman smoothing

Forecasting timeseries with predict

Forecasting timeseries with predict

Plotting text

Plotting text

Defining a custom corpus for plotting text

Defining a custom corpus for plotting text

Plotting State of the Union Addresses

Plotting State of the Union Addresses

Gensim text models

Gensim text models

Animated plots

Animated plots

Create a rotating static plot

Create a rotating static plot

Trails: chemtrails and precognition

Trails: chemtrails and precognition

Mixing trail styles per dataset

Mixing trail styles per dataset

Saving an animation

Saving an animation

Animated interactive plots (plotly backend)

Animated interactive plots (plotly backend)

Story trajectories: brain activity while listening to a story

Story trajectories: brain activity while listening to a story

Morphing through the shapes zoo, with titles

Morphing through the shapes zoo, with titles

Morphing hull surfaces through shapes

Morphing hull surfaces through shapes

The shape of a conversation: one path per turn, colored by its speaker

The shape of a conversation: one path per turn, colored by its speaker

Five paintings, described in words, drawn in their own colors

Five paintings, described in words, drawn in their own colors

A quarter century of the market: six sectors, one space

A quarter century of the market: six sectors, one space

A century of weather: twenty cities as twenty features, one hot path

A century of weather: twenty cities as twenty features, one hot path

Forecasting three regions’ weather while it is drawn

Forecasting three regions' weather while it is drawn

Download all examples in Python source code: auto_examples_python.zip

Download all examples in Jupyter notebooks: auto_examples_jupyter.zip

Gallery generated by Sphinx-Gallery

Next
A basic example
Previous
Morphing through the shapes zoo, with titles
Copyright © 2017-2026, Contextual Dynamics Laboratory
Made with Sphinx and @pradyunsg's Furo