Plotting a Pandas Dataframe
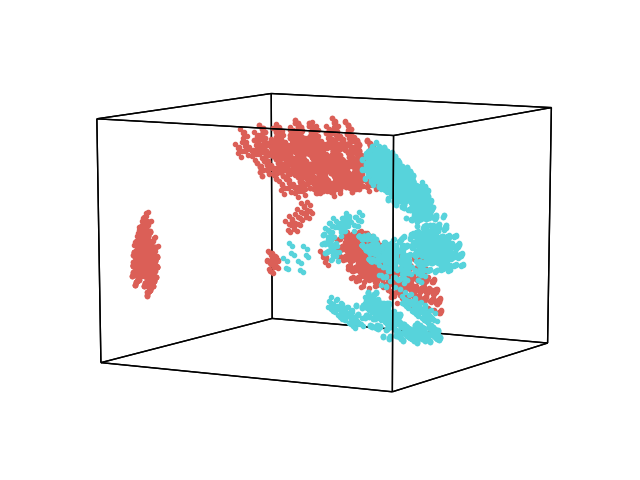
Hypertools supports single-index Pandas Dataframes as input. In this example, we plot the mushrooms dataset from the kaggle database. This is a dataset of text features describing different attributes of a mushroom. Dataframes that contain columns with text are converted into binary feature vectors representing the presence or absences of the feature (see Pandas.Dataframe.get_dummies for more).
Out:
bruises cap-color cap-shape cap-surface gill-attachment gill-color  \
0       t         n         x           s               f          k
1       t         y         x           s               f          k
2       t         w         b           s               f          n
3       t         w         x           y               f          n
4       f         g         x           s               f          k

  gill-size gill-spacing habitat odor    ...    ring-type spore-print-color  \
0         n            c       u    p    ...            p                 k
1         b            c       g    a    ...            p                 n
2         b            c       m    l    ...            p                 n
3         n            c       u    p    ...            p                 k
4         b            w       g    n    ...            e                 n

  stalk-color-above-ring stalk-color-below-ring stalk-root stalk-shape  \
0                      w                      w          e           e
1                      w                      w          c           e
2                      w                      w          c           e
3                      w                      w          e           e
4                      w                      w          e           t

  stalk-surface-above-ring stalk-surface-below-ring veil-color veil-type
0                        s                        s          w         p
1                        s                        s          w         p
2                        s                        s          w         p
3                        s                        s          w         p
4                        s                        s          w         p

[5 rows x 22 columns]
# Code source: Andrew Heusser
# License: MIT

# import
import hypertools as hyp

# load example data
geo = hyp.load('mushrooms')

print(geo.get_data().head())

# plot
geo.plot()
Total running time of the script: ( 0 minutes 0.248 seconds)