HyperTools: A python toolbox for gaining geometric insights into high-dimensional data
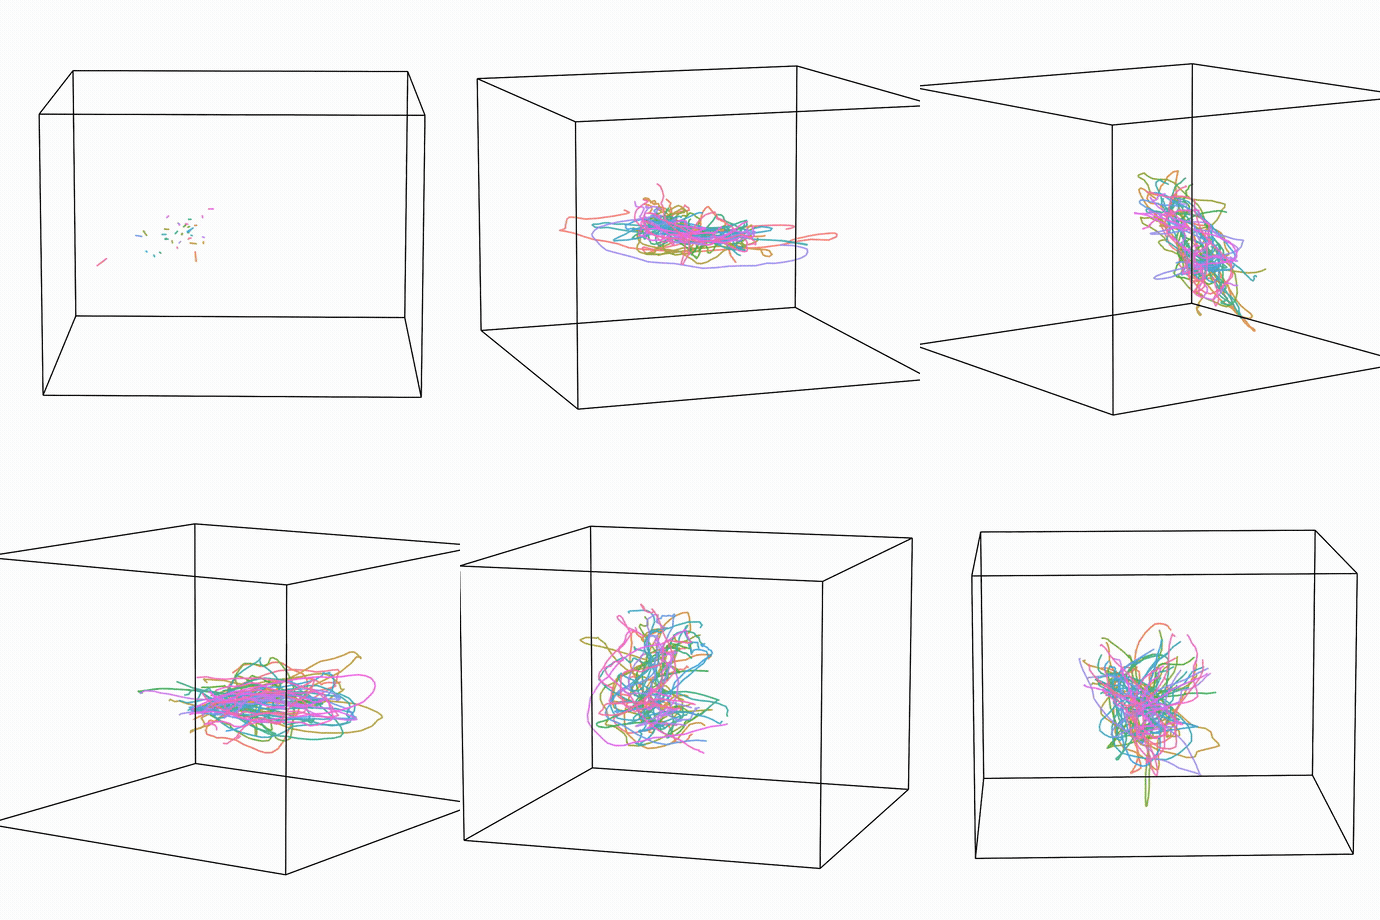
HyperTools is a library for visualizing and manipulating high-dimensional data in Python. It is built on top of matplotlib and plotly (for static and interactive plotting), seaborn (for plot styling), and scikit-learn (for data manipulation). For sample Jupyter notebooks, click here and to read the paper, click here.
Optional features (the plotly backend, HF text embeddings, the Laplace
and Chronos forecasters, autoencoder reducers, gensim vectorizers, Kaggle
loading, LSL streaming, 3-D density iso-surfaces, .xlsx loading) are
pip extras of hypertools, and they install themselves on demand: the
first call that needs one installs that extra’s requirements and carries on,
printing a one-line notice. hypertools.set_autoinstall(False) turns
this off; a missing extra then raises ImportError with the manual
pip install "hypertools[<extra>]" command. See
Optional dependencies for the full list.
Some key features of HyperTools are:
Functions for plotting high-dimensional datasets in 2/3D, statically, animated, or fully interactive (
backend='plotly')A single canonical pipeline – manip, normalize, reduce, align, cluster – composable from every entry point (see The canonical pipeline order)
Dimensionality reduction via PCA, UMAP, t-SNE, and friends, plus optional torch-backed autoencoder reducers
Data alignment across datasets (hyperalignment, Procrustes, the shared response model) and mixture-model (“soft”) clustering
Timeseries forecasting (
hypertools.predict) and missing-data imputation (hypertools.impute)Support for Numpy arrays, Pandas DataFrames – including hierarchical frames, where a row MultiIndex groups observations into leaf trajectories and a column MultiIndex groups features into per-group trajectories (see Hierarchical DataFrames) – text, and (mixed) lists, with loaders for local files, URLs, and hosted datasets
Applying topic models and other text vectorization methods to text data
What changed in each release is listed in the changelog.
Contents:
- API reference
- The canonical pipeline order
- Hierarchical DataFrames
- Animating plots
- Optional dependencies
- How to use HyperTools
- Plot
- Analyze
- Normalize
- Reduce
- Align
- Cluster
- Loading and saving data
- Manipulating data and animating windows and trails
- Fitted models and pipelines
- Hierarchical DataFrames
- Forecasting three regions’ weather while it is drawn
- Plotting text
- News headlines in embedding space: a Hugging Face dataset meets sentence transformers
- Modern scikit-learn models and dynamics
- Mapping Wikipedia with modern text embeddings
- Reddit thread trajectories: one stroke per utterance, one color per speaker
- Plotting streaming data
- Streaming from a Lab Streaming Layer (LSL) device
- Forecasting stock prices with hyp.predict
- Imputing and forecasting a real projectile arc with hyp.impute and hyp.predict
- Story trajectories: brain activity while listening to a story
- A quarter century of the market: six sectors, one space
- A century of weather: twenty cities as twenty features, one hot path
- The shape of a conversation, revealed one turn at a time
- Five paintings, described in words and drawn in their own colors
- Morphing through the shapes zoo
- Gallery of Examples